It was my great pleasure a few weeks ago to interview statistician Roger Lee Berger, co-author of Statistical Inference, perhaps an indispensable text in statistics higher education. Roger, a Professor Emeritus of Arizona State University, calls desert Phoenix his home these days. A link to the recording, as well as an annotated transcript follow.
I connected with Roger some years ago while considering a doctorate program in statistics, and much to my disappointment, I learned he had plans for retirement. I’ve nonetheless been able to lunch with him on occasion, as my in-laws pepper the suburbs of Phoenix. I correctly surmised a keen intellect and enthusiasm for the statistical trade hallmarks, past and present, but I was more struck by the humility, warmth, and graciousness apparent immediately in the friendship we have begun to cultivate. I’ve long believed that academics ought strive for virtue, as they steward knowledge, science, and thus much of the highest achievements humanity can attain. Roger didn’t disappoint.
Disco Ball Computer Science: FORTRAN and Cards
Play for the Statistician: Bridge
Statistical Inference: A Duet of Best Friendship
1970s: Statistical Theory Was Stayin’ Alive
Computing in Statistics Education
Twentieth Century Statistics: State-of-the-Art
Education: Online or Brick-and-Mortar?
Hardest Statistical Concept in Teaching
Graduate Student Spread in Statistics Courses
Onward and Upward in Retirement
Introduction to Roger
NP Slagle: Welcome to AlgoStats, a space that’s safe for machine learning, data science, artificial intelligence, and a litany of others in the taxonomy of statistics, for statistics is back in a big way. Today, it’s my great honor to have Roger Berger, Professor Emeritus at Arizona State University. Dr. Berger studied mathematics as an undergrad in Kansas, then statistics at Purdue under Shanti Gupta. While faculty at Florida State, North Carolina State, and Arizona State Universities, he supervised eleven students and published roughly fifty journal articles, including a textbook co-authored with the late, great George Casella. That book happens to be called Statistical Inference, the text required for mathematical statistics courses I completed during my first foray into grad school. I credit this textbook, along with my professor at the time, Danny Dyer, with jump starting my career in statistics, machine learning and data science. So Professor Berger, a very big welcome.
Roger Berger: Thank you Neil. I’m glad to be here today.
NPS: Yeah, there are a lot of interesting areas that I want to try to cover, and it’s going to be curious to see how we do on time. I want to begin with your personal journey. Who are you? Where do you come from?
RLB: I grew up in a small farming community in Northwest Kansas. I went to the University of Kansas for undergraduate, as you mentioned, and was a major in mathematics, although I essentially had a minor in computer science. Back then, the University of Kansas did not have an undergraduate degree in computer science, so it wasn’t a formal minor, but I had about twenty-seven hours in computer science as well as the mathematics. Then I went to Purdue for graduate school in statistics, and immediately after that, I went to Florida State University for my first teaching position. After five years, I went to North Carolina State University, department of statistics for twenty-two years, and following that, I went to Arizona State University for thirteen more years. I retired from Arizona State University a year ago in May.
NPS: That is certainly their loss, to have such a storied and well-qualified professor for statistics.
Mathematic Mastery
NPS: I’d be interested in knowing a little bit more about what interested you in mathematics? What was it that drew you to mathematics? Was it just native talent? Or, well obviously that has to be there, sort of a prerequisite, but it obviously was also fun for you.
RLB: Yes. I always enjoyed the mathematics. I didn’t have to work terribly hard at it. It wasn’t ever a struggle, but it was fascinating to me. I actually started my undergraduate at University of Kansas as a physics major, but after about three semesters, I realized I was enjoying and understanding the mathematics much more than the physics, so I changed over to mathematics at that time. Also, in my sophomore year is when I started taking computer science courses, and I enjoyed them greatly, and by the same token, I continued to take a lot of computer science courses also.
NPS: That part, actually is new to me, so I’m very interested in digging in there, but first I wanted to ask the question, in the midst of taking these physics classes, which classes in mathematics did you find most interesting?
RLB: These were just when I was a freshman and sophomore, so I was just taking three semesters of calculus, and my fourth semester would have been differential equations. These were just the introductory course. Later on, the courses I really enjoyed were real analysis, that was the one that really was the eye-opening, the first time I was asked to write proofs, and I just found it fascinating that people would think of doing things like proving that the real numbers existed and stuff like that, which it seemed obvious. Real Analysis, I enjoyed numerical analysis, I didn’t enjoy differential equations very much. The course that I had trouble with was modern algebra (editor’s note: sometimes abstract algebra). It was taught just definition, after definition, after proof, after definition, with no motivation whatsoever.
NPS: No geometric interpretation?
RLB: No. Certainly not that. All the rings and fields and so on were just a jumble of definitions. That course, I did struggle with.
NPS: Yeah. It was interesting, when I was in graduate school the first time, it was an algebraist that approached me, wanting me to study under him, and the way that social desirability worked for me, I didn’t hold out for the analysis professors that were the ones that definitely spoke to my fire a lot more so.
Disco Ball Computer Science: Cards and FORTRAN
NPS: The other part that I wanted to return to is computer science. What motivated you to take the classes? And also, I’m sure that my listeners, a lot of whom are going to be millennials and younger, who have gotten degrees and advanced degrees in computer science, what was that like? What were those courses?
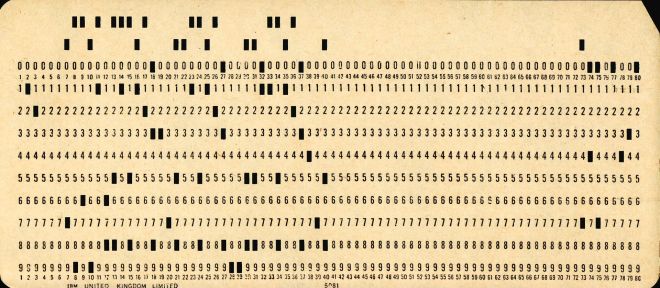
RLB: The reason I started taking computer science, as I said, I came from a very small rural school, and I knew nothing about computers. I knew nothing about programming computers. No introduction to computers at all in high school. I doubt there was a computer in my town. I don’t know what the bank used. When I got to the University, one of my best friends, Dar Daily, was all about computers, and he started taking computing courses from the beginning. I was just interested in what he was doing, seeing him program, seeing him have sheets of output that he was pouring over and stuff like that, trying to figure out what went wrong with his program. It was because of Dar that I realized you could take classes. What were they? They were FORTRAN classes. The first two semesters back then were two semesters of FORTRAN programming, which I enjoyed. I thought it was fascinating to be able to write these programs, and make some big machine the size of a very large room do things for you. How was it done? It was with punch cards. You handed in your deck of … well first of all, you created your deck of punch cards. That involved learning how to fight with a key punch machine, which if you’ve never done that, they’re a beast. Literally as well as figuratively. Then, you hand in your deck, and then you go away for 24 hours, because things are put into a queue, and your program will get run probably within the next 24 hours. You go back, and you get your output, and it’s one page. It has your name on it, and it says, “Error number 3745,” and you basically have hardly any idea what that means. So, you go and pour over your program. I forget, somehow there was some clue as to where things went wrong. You would pour over that, and fix what you thought needed fixing, and you would hand in the new deck of cards and wait another 24 hours. It encouraged understanding what you were doing before you ever sat down to write the program. None of this just put in some things and see what happens, and if it doesn’t do exactly what you think it will, try something else, because you get instant response, and you can try 10 things in the next 10 minutes and see which ones work best.
NPS: Whereas then it would have been like trying to call a customer service switchboard where they say, “Your call will be answered in the order in which it was received.”
RLB: Yes. The wait time is 24 hours.
NPS: Right. If you wish to stay on the line, do so now.
RLB: So, that’s the way programming was for me all the time as an undergraduate. As a graduate student at Purdue, we started using terminals, but it was still a batch processing. I mean, you would write a program and submit it, and you would get output hours later.
NPS: Was this also in FORTRAN?
RLB: If I was programming something for myself to calculate something, it was in FORTRAN, because that’s what I knew best. If it was … the statistical package that they had was BMD, which there used to be a sequel to BMD called BMDP, and I don’t know if it even exists anymore.
NPS: It’s not familiar to me.
RLB: But that was the program we used. I do remember that, as I was just about to finish my Ph.D. in 1977, I went to an ENAR (Eastern North American Region International Biometric Society) meeting at Chapel Hill, North Carolina. That was my first meeting that I went to on my own and presented a paper and so on. There was this buzz around the meeting about something called SAS, which of course was developed in North Carolina. There was discussion of that at the ENAR meeting, and I had no clue what that was. Hardly anybody else did either, because SAS started in the late 1970s as I recall.
NPS: Right, right. And has since spread like wildfire. When I was in my first job with Bell Helicopter, I was exposed to FORTRAN code, and though this was obviously coding that we would do either on terminals or on PCs, but there was still the legacy of having to start the code in the seventh or eighth column, I think. Because the other columns are reserved for error messages.
RLB: Yeah. The commands started in column seven. Before that was a line, command, or whatever they called them, statement number so that you could name a statement number 100, and have goto 100, and it would branch to that line of code. That’s what was before. That was in columns one through five. In column six was a continuation column. If your line went over 80 characters, if your line of code went over 80 characters, you had to put a symbol in column six to tell it that this line was a continuation of the previous line. As you can tell, I still remember FORTRAN perfectly. I could sit down and write a FORTRAN program right now. Whereas, when I program in R or SAS or anything, I have to have a manual with me or an example program to get me going. I don’t have it memorized.
NPS: I can say that even in high tech, that generally is the case, or at least it’s been my experience in programming in different languages, I just have to use Google, which is the best possible manual.
RLB: Yes, I said have a manual, but I do have manuals bookmarked on my computer, and that’s where I go to look up things.
Research in Subset Selection
NPS: Right, right. Wow. Very interesting things. One question I did want to ask you, I tried actually to get a copy of your dissertation, but I had some trouble doing that. Can you speak to the, basically its content and what it was that you were studying in graduate school? Maybe at a high level? Because a lot of the listeners may not know the more specific statistics jargon.
RLB: Purdue was a very fairly theoretical statistics department, and the statistics I was studying was statistical theory, fairly mathematical. I had to take the same qualifying exams as the graduate students in mathematics in probability and in measure theory and in complex analysis. Correction, the exam that I took that was the same as the graduate students was in measure theory and complex analysis. Then, there was a separate qualifying exam in probability and statistics for the statistics graduate students. It was very mathematical, very theoretical for the students who, for listeners who are familiar, the introductory text was Hogg and Craig in mathematical theory, the next text was by Lehmann, Testing Statistical Hypotheses. Other courses I took were in linear models, and multivariate analysis, and decision theory, and major theoretic probability of course, stochastic processes, those were the main courses besides seminar courses. My dissertation, as you mentioned, my dissertation advisor was Shanti Gupta. His area of expertise that he basically began was called subset selection. Subset selection is a very easy to understand problem. Suppose you observe responses on five different treatments, and you want to decide which treatment has the highest mean. So, subset selection is one way of formulating that problem to answer that question. Which of the populations has the highest mean? I was doing some decision theoretic analyses of subset selection procedures in my dissertation. I wanted to work with Professor Gupta. I thought he was a great guy. I thought, because he was the department chair, the head of the department at Purdue, he could probably help me get a job when I finished, which was certainly the case. I knew enough about subset selection to think that I could write a dissertation in it. But, I kind of knew from the start that I wasn’t going to work in subset selection for the rest of my life. I probably wrote three or four papers based on my dissertation and later work on subset selection, but within a few years, I wandered off into other topics.
NPS: Fascinating. It turns out that subset selection is very, very topical. The problem of course has been reformulated and restated, but NP-hardness or NP-completeness can be boiled down to the problem of trying to find an ideal subset. In some of the work that my department has done, actually one of my coworkers, you’d be interested in talking to him, because he has come up with an unbiased estimator for optimal policy assignment. But of course, this is, and I’m guessing, based on what you said, that each of the data points are coming from ostensibly a different population, so that there is a treatment and control comparison, and then there’s some feature vector X that you’re conditioning on, and then you try to figure out which selection would give you the best result? Do you select treatment or control for this particular observed vector? So, it’s similar.
RLB: It’s related, I’m sure. It sounds more complicated than what I was doing.
NPS: I’m not explaining it well, it’s actually really, really simple. Very, very interesting.
Play for a Statistician: Bridge
NPS: We’ll come back to the state of education and research in a few moments, but I wanted to ask you your interest in bridge, I remember we talked about it over one of our lunches. Do you find it fascinating from the perspective of a statistician to try to estimate at least, or at least do a back of the envelope calculation on how probable it is that you’re going to be able to get the hand that you want?
RLB: No.
NPS: Okay. Good, good. It was actually kind of what I was expecting.
RLB: We played cards at home from as long as I can remember with my parents and siblings. My aunts and uncles and so on would play cards when we got together on Sundays and so on. So, playing cards was just a social thing to do. When I went to the university, and was living in a dorm, one way of having social interaction was to go down to the lobby and play cards, and bridge was the usual game, as well as hearts. So, I learned to play bridge by just watching other people play bridge in the lobby at the university. Then, when I went to graduate school at Purdue, it turned out that there was a lunchtime bridge game, faculty and graduate students would play bridge, and that’s where I really got into it. George Casella and I and some others would go to the local bridge club and play bridge once or twice a week. Contract bridge, that’s a little bit more serious bridge. That’s when I really enjoyed it, because of the company as well as the bridge. I continued to play bridge at Florida State. Chuck McCulloch was my main partner there, and I played for a few years when we moved to North Carolina, but that faded away. I haven’t played bridge in thirty years. It was just a pleasant social, intellectually challenging, but I never even semi-formally was calculating probabilities about anything. You learn what to expect and what not to expect, but there’s no formal numeric calculation of probabilities at all. So, fairly first order. I would have been interested in bridge had I been an English major. It had nothing to do with the math.
An Outlier Beard
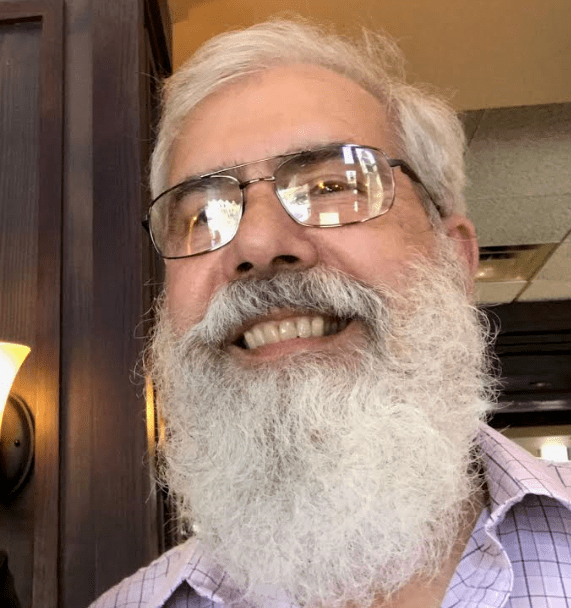
NPS: Right, right. That totally makes sense. Speaking of George Casella, I do definitely want to move on to the book in a moment, but one last question from this section is, the beard. The beard is something that I found in looking at teachers’ reviews of you online. The beard does get mentioned, and of course, the reviews are generally quite positive.
RLB: About the beard?
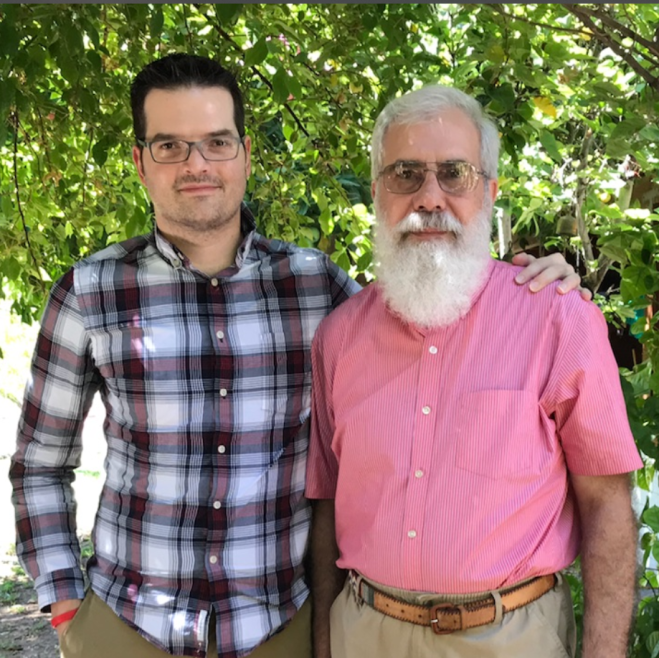
NPS: About the beard, yeah. Not the man wearing it. So, I’m curious about it, because it clearly takes some time to grow a beard. Listeners can go to the website and see the picture that I’ll post of the two of us, and I’m almost clean shaven and he has this beard that I’m envious of.
RLB: So, the question I always get asked is, “How long have you had the beard?” And the answer is 49 years. I grew a beard as soon as I left high school. Actually I grew a beard between my junior and senior year, but was told that I could not have a beard in high school, which I knew full well. So, after one day in my senior year, I shaved my beard off. Then, as soon as I left high school, I grew a beard, and I’ve had it ever since. That’s 49 years. Next summer will be the fiftieth anniversary of my beard.
NPS: Are you going to dye it golden for a week to celebrate?
RLB: No, I don’t think so. I just think I look better with the beard. Of course, when I started, this was 1969, and there were social implications of growing a beard and rebelling against the machine and things like that I suppose, but I just think I would rather have a beard. I have a very slender face, if you saw my high school yearbook picture, you would see I have this very slender face, or at least the last time I saw it, I did. So, I thought the beard made me look better. And also, it’s easy to take care of. It gets trimmed once a month or so, and that’s it. None of this getting up every day and spending five or ten minutes in front of the mirror, it’s just a lot of wasted time.
NPS: I’m always fascinated to hear high schools and institutions of that order ruling out beards, when you look at most of the presidents before the twentieth century, after Johnson, around Andrew Jackson, they started having beards.
RLB: Well, I remember exactly, at that first day of my senior year, when I had my summer beard. We had an assembly, and the principal was up there, and he said, “I notice some of you young men have facial hair. If facial hair were allowed in this high school, I would have facial hair. Do not return tomorrow with facial hair.” Basically I was a very good kid and didn’t break the rules, so I shaved off my beard that night.
NPS: You were compliant up to a point.
RLB: Yes.
Statistical Inference: A Duet of Best Friendship
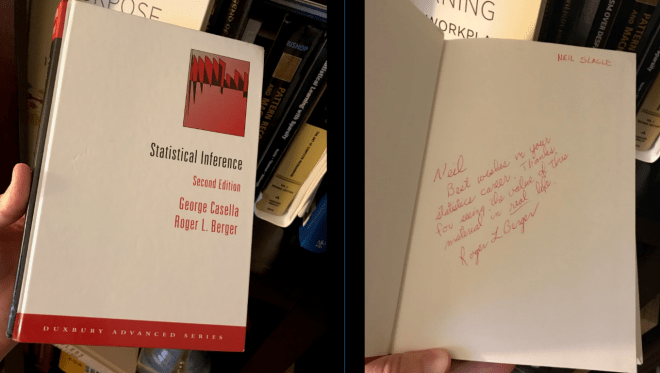
NPS: You mentioned George Casella earlier, very interested in digging into the book. I had my copy actually upstairs. I meant to bring it down here, but the book, Statistical Inference. I just have to preface by saying that of all of the, I guess you can consider it partially introductory, and then it goes on to intermediate and some advanced material. Of all the textbooks that I’ve come across in statistics and really, probably in mathematics, I would say that the style of the prose, and the way the material is presented, it is one of the few textbooks that I revisit on a fairly regular basis. It actually sits on my nightstand. I want to hear more about the book. Where did it come from? Where was the decision coming from to write it?
RLB: To back up, George Casella was my classmate at Purdue in graduate school. He started one year before me, but after a year or so, he changed to the Ph.D. program, so we basically were in the Ph.D. program together. We graduated at the same time in 1977, and as I mentioned earlier, we played bridge together. He was my best friend in graduate school and continued to be after that. George and I would get together at meetings and so on after we went on our separate ways, just connect again and so on. We kept in touch all the time. In 1983, I believe, at an ENAR meeting in Nashville, Tennessee, he asked me if I would be interested in writing an introductory statistical inference book with him. He had some ideas about why a new book was needed. As I mentioned earlier, the standard text at that time for master’s level statistical theory was Hogg and Craig. So, part of his ideas were perceived improvements on Hogg and Craig, which was the book at that time, and continued to be for many years. After thinking about it for a short while, I agreed to do this with him. I only did it because it was George, because he was my best friend, because I thought this would be enjoyable. I did not think that this was a good move to make at that point in my career. At that point, I was an associate professor without tenure, because I moved from Florida State to NC State, I had to give up the tenure that I had at Florida State.
NPS: Wow, that’s a big change.
RLB: And start that, not start it from scratch, but be untenured for a while. So I did not think this was a great career move. Writing a book doesn’t get you immediate stuff to put on your resume to convince somebody to give you tenure for example. But, it was only because it was George, and because I thought he had some good ideas, and because I had some similar ideas, that I agreed to do this. It took us seven years to write the book. The first edition came out in about 1990. I forget what the copyright date on it is, but it’s roughly 1990. So, it took seven years. We worked on it off and on. Sometimes we made a lot of progress. Sometimes it was put aside for a year during that time. What you said about the writing style was heartwarming to me, because the main point, the two main points of the book were one, some additions and changes in content from Hogg and Craig, for example. Some things that we thought should be covered in an introductory text, which hadn’t been covered in our introductory courses. But, the other thing was to make it more of a textbook in that it wasn’t just theorems and proofs, but that there was explanation in between. We had both taught this level of course, and we had begun to understand where students had difficulties with various topics. So, in our book, we were going to try to help them through those difficulties to explain to them, “Now, look at what we just did, and why did we do it that way? This is a good idea to keep in mind if you have a similar problem, to think about things like this,” and so on. Yes, it is probably more conversational than many textbooks. That means that you probably don’t cover as much material, if you’re taking time to do explanations like that, then that’s less space for theorems and proofs and things like that. But, anyway. We, of course, had no idea if it would be successful or not. You spend seven years writing a book and you put it out there, and you have no idea if anybody’s going to ever notice it. It turned out that it was incredibly well-received and continues to be one of the most used books at the master’s level for introductory statistics. I recently learned that not only in statistics departments, but also in business schools, is it used frequently.
NPS: Wow.
RLB: In what they would call an econometrics course. I got the phone call from a publisher who publishes business textbooks, and he said, “I heard that your book with George Casella is out of print, and we want to acquire it and revive it, because this is an essential text in business.” He was wrong. It wasn’t out of print. I don’t know where he got that information, but then he sent me some data, and it turns out that we sell about as many textbooks to business schools as we do to mathematics and statistics departments. So, it was wonderful good luck. I mean, we had no idea that it would be so well-received, and we’re pleased that it has been, and certainly by far, that’s what I’m recognized for the most when I go to meetings and young people come up and start talking to me about the course that they had from the book. That’s very heartwarming.
NPS: Yeah. Those were the two, they were the first graduate level statistics classes that I’d had, mathematical statistics. And I absolutely loved the book. It is starting to wear on the pages, I look at it so much, and the conversational style, the jokes that you find in there, are actually very funny. Maybe I’m just a boring person, but I find the humor to be great in the book. Yeah. I believe that the hardcover copy of it now, if you try to find it on Amazon, it’s like $300.
RLB: Yes. It’s some ridiculous price.
NPS: You can get the soft cover, but at multiple departments where I’ve worked, at Microsoft, I’ve gotten people interested in the book, and in one of the departments, they ordered the book for everybody in the department, so that they could start reading it. There was a guy that I worked with who’s like a principal software guy there, and he said to me, “I notice that this book is really notation heavy.” And I was thinking, “Wow, you’re going to die if you look at a monograph.”
RLB: Yes. We tried not to be notation heavy.
NPS: So, you’ve answered a couple of these questions that I had pretty well, so the inclusion of Arthur Conan Doyle and his quotes.
RLB: That was all George’s doing. He was the Sherlock Holmes aficionado and he came up with the quotes for each chapter. Of course, I looked at them, and told him they were fine, but it’s just a little fun thing to start the chapter with, and because the Sherlock Holmes stuff is in the public domain, we didn’t have to get copyright permissions from anybody to use them. So, that worked out well, also. Anyway though, that was all George.
NPS: Wow. So, your friendship with George, do you have any words to sort of sum that up?
RLB: Well, George was a great friend, but he was also a great statistician. It’s amazing how much he did in so many different areas, how many students he directed and touched the lives of and so on. He and I wrote one book that I’m very proud of, but George actually wrote nine books with other authors as well as hundreds of journal articles and so on. He was a great collaborator.
NPS: So you’re saying he had nine other best friends behind your back, right?
RLB: Yeah. Some of them are good friends of mine, too. A funny story, when George died a few years ago, I had found a YouTube of someone speaking at a statistics conference, saying some nice words about George. He mentioned that George had asked him to be the co-author of Statistical Inference before he asked me.
NPS: Wonderful to hear.
RLB: Well, I knew that. So, I didn’t know he had asked this particular person, but I knew George had talked to some of his colleagues at Cornell, which would have probably made writing the book easier, to have somebody right there. It’s only my good luck that other people said no. But I wonder what the book would have looked like if it had been George and somebody else. Anyway, George was a wonderful friend and a great statistician. He collaborated with people in agriculture and biology. At the end of his life, he was doing stuff in genomics and so on with the ag [editor’s note: short for “agriculture”] department and the medical school at the University of Florida. It was a great loss to statistics as well as to my friendship when George died.
NPS: Yeah. Sounds like a really remarkable gentleman.
RLB: And, we wrote three, or four, or five papers together, journal articles. They were always as much fun as the book, also. It was so much fun to collaborate with him and bounce ideas off of each other and so on. Those papers were always easy and great fun.
1970s: Statistical Theory Was Stayin’ Alive
NPS: Those professional relationships are very, very valuable. I’m hoping as I continue my career that I will find similar individuals. Moving on, statistics as a scientific pursuit. What would you say is, how would you characterize sort of the nature of the field when you fell into it? Sort of what was the state of the art? You mentioned decision theory and a couple of other topics. So, from your perspective?
RLB: When I got into it at Purdue and because I was at Purdue, like I mentioned, it was very theoretical. It was very decision theoretic oriented. It was very much about loss functions, and risk functions, and optimality properties, and you still see that in Statistical Inference, in our textbook. That’s how George and I were taught. That’s what we think are important topics. At Purdue, there was very little applications, there were a couple of statisticians who did the applied statistics with the other departments, the agriculture departments, the psychology, and nutrition and things like that.
NPS: But not much interdisciplinary?
RLB: But not much interdisciplinary. The interdisciplinary was with the math department one floor up in the building. That was interdisciplinary research for the statistics department at Purdue. So, that was my way, that is and was my way of looking at statistics, from a mathematical viewpoint and so on. Back then, the best journal to publish in was the Annals of Statistics. Journal of the American Statistical Association was down a few steps from the Annals of Statistics. That was just the training.
NPS: Right. I find that interesting, because I was watching, and I meant to send you a link to this. I was watching a video of C.R. Rao holding a seminar, this had been broadcast on PBS, I think maybe 1980, something like that, or 1981, 1982. So, it would have been close to the time that you defended your dissertation, or just a few years after that. He was making this comment, and I must say that I do disagree with this comment, as much as I think he is obviously a God in statistics, but he made the comment that people were probably mostly, or how did he say it? Young people were not going into statistics as a field to study because they wanted to solve deep statistical problems. That it had, in his judgment, more to do with solving the applied problems outside. I found that kind of interesting, because of, partly of what you just said, but also my interest in statistics. I mean, admittedly, it’s forty years later, but I found that interesting. I’ll hunt down that link and send it to you. It’s actually a very nice discussion between him and Chernoff is there and a few others.
RLB: Yeah. I’m surprised.
NPS: I was surprised.
RLB: In 1980. I mean now, I would believe that, but in 1980, the people I was in contact with were still doing statistics for statistics sake.
NPS: Right, right.
RLB: Very little applications.
Computing in Statistics Education
NPS: That’s certainly been my draw to statistics. It’s not because I’m interested in applying it, I don’t want to tell my tech lead that, but I’m more interested in solving problems that are statistical in nature. So, this is actually, this is kind of a broad question that I should have put under here. To what extent were you using PC, so you had these computer science courses that you took as an undergrad, and some as a graduate student. To what extent did having the PC and having studied computer science influence the statistics curricula that you would offer in your courses that you would teach? I guess early on, to start with.
RLB: Very little. I was usually teaching the theoretical statistics courses. Other people were usually teaching the applied statistics courses. And back then, the theoretical statistics courses were mathematical theoretics, not MCMC or things like that where you need computing power, that hadn’t been developed yet, or that wasn’t well-known. I used the computer, I was always the last adopter of new technology, I think.
NPS: You still don’t carry a cell phone.
RLB: When everybody else figured out how to make slides and use a projector, then I let them show me how to do it. I never was the first one to figure out how to use LaTeX I was the last one to use LaTeX after they figured it out, then they could teach me very quickly, and so on. In classes, only in the last years when I was teaching undergraduate statistics at Arizona State, and was teaching the introductory applied courses where you learn about t-tests and analysis of variance and so on, was I using statistical packages a lot, and the students were expected to do all their computing.
RLB: I think it’s great. I mean, the few applied type courses I had in graduate school, much of it was about clever shortcuts for computing sums of squares in an analysis of variance, and things like that, which is a total waste of time now.
NPS: Right, the numerical recipes.
RLB: If I look at a new textbook, and if they’re explaining the computational formula for sums of squares and an analysis of variance today, that’s ridiculous. You use a computer, because the computer, if you get the data in right, and you tell it to do the right thing, it’ll do the calculation correctly. Whereas if I’m doing it by hand, I’m going to make a mistake. So, when I was teaching introductory statistics for undergraduates in more recent years, they were expected to do all their homework using a computer package like Minitab or something. Of course that’s the way you do it. But I was never…
NPS: You were never all that thrilled about it.
RLB: I was never using it in my theoretical statistics classes. Those were about theory, not about computing.
NPS: Yeah. About pen and paper.
RLB: Exactly.
Twentieth Century Statistics: State-of-the-Art
NPS: That’s my kind of course, for sure. What would you say, over the course of, actually I guess, over the course of the past century. I was going ask over the course of your career, but if you look back at stats history in the twentieth century and in the early twenty-first century, what are the most significant results? And I guess I’d say certainly start with theoretic results.
RLB: Well, the last century encompasses a good deal of modern statistics. So, it even encompasses the development of maximum likelihood and things like that. I don’t know if R.A. Fisher invented maximum likelihood, but he certainly did a lot to popularize it. It involved the development of considering about hypothesis testing, the Neyman–Pearson lemma in the 1930s. It involved the other big theorems in mathematical statistics, the Rao–Blackwell theorem.
NPS: One of my favorites.
RLB: Development of sufficiency, and those kinds of ideas. The Lehmann–Scheffé theorem, and linear models and so on. All of those are huge benchmarks in the development of theoretical statistics. One of the things I enjoyed about being a student of statistics in the 1970s was that many of those people were still with us, and I got to meet them. One of my fond memories is, at Purdue, one of the Purdue symposiums was going on, and I was tasked with driving down to Indianapolis to pick up Jerzy Neyman from the airport and driving him back to Lafayette. Had him an hour in the car, with only him and Lucien La Cam. So, I met Jerzy Neyman, who was a wonderful guy. I met David Blackwell. I’ve met C.R. Rao, although not very much. So a lot of these famous names, I met Henry Scheffé. So, a lot of these famous people that have theorems named after them were people I actually knew. Those were all big things. Then, I would say the other big developments are the recent things in Bayesian statistics, Monte Carlo Markov chains, Gibbs sampler and those kinds of things. Prior to that, the use of Bayesian procedures just relied on a few simple examples with conjugate families.
NPS: To make it analytically tractable?
RLB: That you could do the math for, and other than that, you couldn’t do it. Now, you can do Bayes on just about any model and any prior that you want to dream up by doing a simulation and using MCMC or something more sophisticated than that.
RLB: The really modern stuff, which is very important, such as artificial intelligence and neuro networks, and machine learning, and all that, I think that is playing a huge role in the use of statistics today. But, to be honest, I know very little about it. That came too late in my career for me to really understand it. I think it’s obvious that those are going to be huge, have a huge impact in the use of statistics, but I really can’t speak to why, or which is best, or what they mean, or anything like that.
NPS: It turns out, you probably know more about them than you realize. That when techniques, of course are just repackaged and using more processing horsepower in order to solve the problems. That has been an interesting problem that I’ve seen in industry. When we interviewed people, what are their fundamentals in? They may have had a course or two in graduate level statistics, but it’s almost always applied statistics, not statistics theory.
RLB: On that idea, what I wonder about is all of the things that I mentioned originally involving optimality criteria and developing good procedures judged against some optimality criteria and things like that, I don’t know and I don’t understand how these very modern procedures, things like machine learning and so on, fit into that paradigm. My impression is, and I could be completely wrong, that people develop clever new computing procedures, and they seem to find that they work well in some situations, or whatever, and that’s what people use until the next big new idea comes along. But, I doubt that there’s any idea of optimality criteria. I just can’t imagine that they could be analyzed in that way. So, that might be saying that all this stuff that we learned about in the middle of the 20th century is becoming pretty irrelevant, I don’t know.
NPS: So, it turns out, actually, and being in the midst of, having been in a program where I was exposed to a lot of these ideas, I can tell you that the easy answer is that the first part of what you said is exactly correct. The techniques have only recently come about, a lot of these techniques. Decision trees have been around for a long time, and so have artificial neural networks. But, the theory behind why they work is very much behind. I am hoping to try to bring some connection between what you’re talking about, that came out of the twentieth century, Rao, Blackwell, Neyman, Scheffé. All of these excellent theorems that a lot of machine learning people don’t know about, so they don’t even know where to start, as far as coming up with a theoretical framework in that context.
NPS: Yeah, so far, it is that applied scientists and software developers have stumbled on things that work, and they don’t know how to explain why they work. Part of what I’m hoping to do with this blog, and with interviews like this, is to try to evangelize statistics. Make statistics, how dare I even say it, make statistics great again. I didn’t want to say that.
Online Versus Brick-and-Mortar
NPS: So, let’s see. What else do we have? We’re going to jump over now to education from the standpoint of instruction, not so much the material that was taught, or the direction that research is or should be going, but more say, to start with, your take on MOOCS, the online classes and course work and degree programs that seem to be at least to some extent, supplanting brick-and-mortar.
RLB: Well, I still have questions about how valuable they are, and about how much students learn in those classes. I taught one online class, I confess, and I did not think it was a great learning experience for the students.
NPS: I found reviews of that online. So yes, I think they concurred.
RLB: I think for some introductory classes, well I think that in all classes, whether it’s in person or online, or anything, much of the value of the class depends upon the input of the students. It’s not all about the instructor. It’s not all about is this guy a great instructor? So the students learn a lot. Or is he not a great instructor, so the students don’t learn so much. The amount that the students get out of the class depends a great deal on what they put into it. So, in the same way, for an online class, I’m sure that there are some students who are very dedicated and are very eager to learn, and they learn a whole lot from an online class. But, I think it’s very easy for students to slide by and not learn so much in an online class, and I just fear that that’s what most of them are doing, that yes, the few very motivated students, it might be a great opportunity, but for the majority of students, they will only learn the minimum amount required. I know, I have friends who teach online master’s degree programs in statistics, those are very popular, and some of them are very huge, like the one at Penn State and so on. It’s servicing hundreds and hundreds of students a year, I believe. I guess it will just remain to see what the marketplace thinks about those graduates. If those people go out and are hired to good jobs and the employers are happy with what they’ve learned and so on, well then that’s good. That means that the online program is working. I think the marketplace will tell us if those students are coming out and are not as well prepared as the ones that go to brick and mortar master’s programs and so on. So, we’ll see. This is just because of my personal style, I suppose, I get a lot from the interaction in the class, the interaction with the other students, and the interaction with the professor. So, as I was a student, a lot of what I got out of the class was because of my interaction with other students and with the professor and being able to ask questions in real time and things like that. I just find it hard to understand how online delivery can be as good as in person delivery.
NPS: Well certainly here, you’re preaching to the choir. Maybe it’s selection bias on my part, but I know that the companies that I’ve worked at, preferential treatment obviously is given to people who have the brick and mortar degrees, because it demonstrates that they have been able to go, spend this time of their life interacting with others, not just the professor, but other students. Isolating that doesn’t seem like a good idea. I actually read an interesting book that further asserts that hypothesis with dramatic conclusions [Weapons of Math Destruction], that’s actually in an article I wrote earlier, so I’ll tell you about that book later. What would you say … so, conditioning on brick and mortar, what would you say is sort of the optimal enrollment size for classes that you taught? That is sort of pivoting on your own personal style, but across several different years of teaching?
RLB: Well, this is where my ideas are different than a lot of people. I do not think that there is anything inherently bad about large classes. Part of the reason why I think that is because the best class that I had as an undergraduate at the University of Kansas was my freshman chemistry class. It was taught by Dr. Clark E. Bricker, and it was taught in an auditorium with 500 to 600 students.
NPS: Wow.
RLB: He did a spectacular job, and I learned so much chemistry in those two semesters from Dr. Bricker. Now, part of my positive response to that class was because of him and his style. He knew how to teach a class that big. It ran like a well-oiled machine. He had the uncanny ability to learn the names of all 600 students. Within a few weeks of that class starting when I was a freshman, I happened to walk past him on the sidewalk walking across campus, and he said, “Good morning, Mr. Berger,” and I was speechless.
NPS: It wasn’t the beard.
RLB: It wasn’t the beard. Everybody had a beard.
NPS: Oh okay.
RLB: I taught at North Carolina State. I taught graduate level introductory statistical methods classes to classes of 120 students. These were introductory stats classes for majors in the biological sciences. So, those were ag students and biology students and things like that. I would give lectures to 120 or more students in a semester, and give them all exams in class, and they did homework every week, which I had help grading, obviously from graduate students, but all the homework got graded, and I think I did a good job. My course reviews said I did a good job.
NPS: Definitely. That’s what I saw online.
RLB: I believe that large classes can be just as effective as small classes. Now, small classes are just fine. I mean, it’s great to have a class with 10 students where you get to know each one very well, and so on. But, I don’t think that that necessarily makes it a good class, because it has only 10 students. Some classes you need more than 10 students, because if you only have 10 students, you don’t get any reaction from them. Whereas if it’s bigger, there’s going to be more talkative people that will at least give you some reaction and help things move along. The more advanced the class gets, the smaller they tend to get, and that may be necessary, because you need to be able to tailor things more individually as people have difficulty with this or that point. That’s a real sticking point, that you can take detours and spend time talking about something that you hadn’t planned to talk about and so on. That can’t be done when you have a big class and, okay one person’s having trouble with this, but I can’t spend the time for 50 students talking about this one thing, and stuff like that. Anyway, I guess the only thing I have to say there, is that large classes can be very effective, and when I was an administrator, complaints about the fact that, or “The reason why I got lousy teaching reviews is because I had 25 students in my class, and you can’t teach a class for 25 students. I need a class of 15 students.” My reaction to that was, “You can’t teach a class of 25 students, but there’s no evidence you can teach a class of 15 students either.”
NPS: Right, right. That’s only one data point. The variance is infinite. We have just a few more questions, we’re a little bit over time. It is all right to continue?
RLB: Sure.
Hardest Statistical Concept in Teaching
NPS: All right. What would you say, across your career, and this is across all classes, this would be the introductory level, then of course intermediate, and then all the way up to graduate. What is the hardest statistical concept to teach? What is it that people consistently have the most trouble with?
RLB: I think the hardest, the topic that I had the hardest time teaching was linear models. I taught master’s level linear models class at North Carolina State for several years. If students don’t see the data and see the problem in a geometric fashion, then linear models is just a bunch of pushing matrices around, and learning theorems about matrices, and it’s hard. I mean, it’s hard to absorb all that. If you can think geometrically, in terms of the data points, and the model space is a linear subspace of the set where the data live, and least squares, for example, is figuring out which linear subspace most closely fits those data points from a least squares sense, and so on. It all makes a whole lot more sense if you think in terms of projections, estimators being projections of the data on to subspaces and so on. It all kind of fits together, and then you have to learn the details about how you do all this with matrices and so on. You have to learn that anyway. But if all you have to work with is the matrix theory, I find it difficult to understand, and I guess I found it difficult to teach to people who were only thinking in those terms.
NPS: Yeah. I was thinking yesterday, when I was thinking about graduate level math work that I was exposed to, graduate level material, so I was trying to think about what I would be asking you about, and the thought kept coming to mind, and I’ve thought this for years, that a big part of learning any piece of math, is being able to relate it to some geometric concept, because that’s the way that our brains are wired to operate in this 3-D space. That might be higher dimensional, I don’t know. For some people, it’s 2-D.
RLB: If you can see it in three, then…
NPS: Then you’re winning.
RLB: Then that’s all you need. Then that probably works for higher dimensions, too. But, I think you need 3-D rather than 2-D for some things.
NPS: Absolutely.
RLB: To get the whole idea.
Graduate Student Major Spread in Statistics Courses
NPS: What would you say, so for statistics graduate students that you met or taught, what was sort of the balance between those that were studying pure statistics as a graduate degree, versus those that were from other disciplines that needed the credit?
RLB: Well, it just varied a lot with the class. Like I mentioned, those large introductory graduate classes for the biological sciences, those were virtually all students from other disciplines, and they were great fun. I loved teaching those classes. And, at that point, the students are in there because they know that they need to learn this material. When you’re teaching undergraduates a required introductory class, they may just be taking it to fulfill a requirement, a math degree requirement or something, and they don’t have any…
NPS: They don’t care anything about it.
RLB: They don’t really care, except to get through the class. But, in the graduate school, the students usually, at least were convinced that in order to write their thesis, they needed to understand this material. Whether they wanted to or not, they knew that this was something they really needed to understand in order to write their thesis, which they wanted to do to go off and be wildlife biologists or whatever they were going to be. So, those classes were completely students from other disciplines. When I was teaching master’s level statistical theory, like from the book, Statistical Inference, those classes were about 60% math [statistics] graduate students and 40% students from other classes. A lot of them were from business, and then some of them were from other disciplines. Some of them were students that I had had in that applied statistics class from biology, who …
NPS: Wanted to know more?
RLB: … maybe just liked the way I taught, or something. So, they would come and try to take the class.
NPS: That is exactly the next question I was going to ask is, sort of how many people, how often would it happen that you would sort of win somebody over to the side, not just of you and your teaching style, but win somebody over to statistics as a discipline? So they switch, because of a class they took?
RLB: Not very often.
NPS: Most of them are set in their ways? What they want?
RLB: Yeah. And if you’re in a master’s program, and you plan to be done in two years.
NPS: Yeah, I guess so.
RLB: It’s a little tough to change your mind completely.
NPS: Did that happen much on the undergrad level?
RLB: Yes. As an undergraduate, a lot of the time, math students would change over to statistics or would get a dual degree, or co-major in math and statistics and so on. Here at Arizona State, I was in a department that included both math and statistics, and I must say, the mathematicians were very supportive of statistics and told their students that statistics was also something important that they needed to know. So, they were not discouraged, math students were not discouraged from also exploring more statistics than what was required for the math degree. There, some of our best students were not students who started in statistics when they were freshmen, but were students that started in mathematics and then maybe got a co-degree or dual degree in both math and statistics. And part of that, of course is because they really made the decision when one or two years into their degree program to also add statistics, so that was a positive decision that they made that indicated already right there that they were really interested in this and were going to work hard at it.
NPS: Yeah. When I was in the master’s program for math, my Algebraist advisor didn’t want me to take the statistics classes, and it did suck me in. I took the first mathematical statistics class, which had the book, and then I had to take the sequel. And I ended up taking another graduate class with that professor, who was the chair at the time, of the department.
Motivating the Cauchy
NPS: I wanted to ask about variance. One quick question. In the course of teaching statistics throughout your career, the problem of distributions without variance. Was that a hard concept for people to understand? Like the Cauchy distribution or ratios of exponentials? Things that give you pathological … pathological sounds really, really negative, but just natural distributions that don’t have variance, and thus you can’t rely on CLT.
RLB: I always used that example, you introduce the Cauchy distribution, and okay, why is it interesting, well, it doesn’t have a variance. It doesn’t have a mean. So, that’s a curiosity.
NPS: And it’s a ratio of two standard normals.
RLB: Well, but that’s the kicker. If it was only the Cauchy distribution, here’s this mathematical oddball. It doesn’t have a variance, but then of course, when do you ever observe anything that doesn’t have a finite support? Everything has a variance. Not only do you need an infinite support, but you need an infinite support with tail behavior that is such that you don’t have a variance, and you can dismiss it all as a mathematical curiosity. But then, when you learn that you take the ratio of two standard normals, and you have a Cauchy distribution, all the sudden, that’s very important, because people are calculating ratios all the time.
NPS: As the kids say, “Shit gets real.”
RLB: And, so that’s the payoff. That’s the kicker as to why you have to worry about distributions with infinite variances, because you can calculate things that, according to the theory, would have an infinite variance. If it were just the Cauchy distribution, here’s the formula, try to calculate the mean, can’t do the integral, it doesn’t exist. That would be curious, but it wouldn’t be that interesting.
NPS: Right. Exactly. I have, it seems like, at every company I’ve worked at, and in every department that I’ve worked at, I have had to educate people about that, because the assumption is, you just go with the central limit theorem, everything’s a z-test or for God sakes, they even misapplied the t-test. They use it when they should use a z-test, even under the asymptotic assumptions.
Estimators Abound
NPS: So, I guess I want to do maybe, let’s see, techniques for building estimators. What would you say is your favorite? Method of moments? Maximum likelihood? EM? Bayes?
RLB: Well, not method of moments, because I think it’s pretty limited in applicability. I’ve never thought about it much, but I don’t know how you do regression with method of moments. So, I guess make regression coefficients and stuff like that, but I suppose you could do something, but that’s … method of moments is great for estimating a population mean, that’s real simple to motivate for that, but beyond that, it gets a little sticky.
NPS: I’ve used it for beta parameters. Because the maximum likelihood is hell to do that.
RLB: Yeah. Exactly. Yeah, I think we do that in the book.
NPS: Oh, okay.
RLB: I think we thought of that first.
NPS: Yeah. I’m sure you did.
RLB: No, gamma, I think our example was gamma. So, not method of moments. Maximum likelihood, I think is a least squares, which aren’t the same thing, obviously. Method of Moments, I mean Maximum Likelihood has a disadvantage that it’s tied to a particular model, whereas least squares is kind of a concept like I was talking about earlier, a geometric concept of how do you approximate this cloud of points with a linear subspace, so Method of Moments, and of course, least squares, you can do with non-linear things too. So, that’s probably the most useful. EM and Bayes, I think of EM as a way of calculating Maximum Likelihood estimates, and so on. So, I think that comes under there. Bayes, I think are important and with modern technology, you can do Bayes with simulation methods, MCMC and things like that. So, that’s far more useful than they were back in the day that I first learned about Bayes estimators, that’s for sure. We haven’t talked about Bayes and Frequentist. I’ve always been a…
NPS: Oh, that question is in here, and I missed it somehow.
RLB: I’ve always been a real agnostic about Frequentist and Bayes and so on. Whatever works, works. So, if you have a legitimate prior, and so on, you should use Bayes. There’s no doubt about it. But in situations where you don’t have that much information then you need something else, and the Frequentist might be the better option in those cases. So, I’m not a dogmatic Bayesian that you have to stuff every problem into a Bayes mold. If you don’t have the information to do that, then you shouldn’t have to sit around contemplating your navel coming up with a prior, even though the economists like to think about that. How do you elicit a prior from someone no matter what they know or don’t know? So, Bayes are fine. But you need a computer to do Bayes in a modern sense. You might be able to do least squares and maximum likelihood with a pencil and paper, if you’re worried about lack of electricity.
NPS: Right. Or your generator gives out. Well that leaves us, I guess, with just two more questions. This pivots sort of on what you were saying, and I mentioned this earlier, that I feel like, in my own experience, people I’ve met who are coming out of grad school and are specializing in machine learning, a lot of this statistical know-how has fallen by the wayside mainly for the reasons that you mentioned. That you can do these things with computers so readily and so easily. But, what I’ve discovered is that there’s no real understanding of what the technique is doing under the hood. Even with the simpler ones, where it’s fairly straight forward, like with a decision tree. Are you splitting on information gain, or least squares or some other optimality approach?
Evangelical Statistics
NPS: How do we evangelize statistics? How do we get more sharp math and machine learning as it were, kids interested in statistics and the work that’s come out of the last century?
RLB: Well, not at that level, at a lower level, we still have difficulty getting good students into undergraduate statistics programs. Students may see, a lot of students are seeing statistics in high school, in AP statistics and so on, but I don’t think that they are being, that those are being taught in a way that gives students the idea that this might be a path to a career. So, when they come to the university, they don’t think, “Oh, I’m going to major in statistics.” Somehow they think, “I’m going to major in math,” or whatever else it’s going to be. So, I think part of the evangelization would have to start at very low level, in high school, letting those students know, and there’s a lot of them every year. Hundreds of thousands that take AP statistics. Letting them know that there’s a future here, and that they can pursue this in depth as an undergraduate, and so on. As far as … I think the evangelization has to be in terms of what we add, what value we add, to the solution of the problem. If people are happy with people who know how to run programs to do machine learning, and so on, well then, they’re going to be satisfied with that, and there won’t be any need for more statistics and so on. I think the evangelization we have to do is to continue to be relevant, and to continue to work on problems and come up with solutions that add value to the end users, to the businesses or researchers or whatever that are using the material. I don’t think just jumping up and down and saying, “Look, you need to think about optimality criteria,” will do the trick. That’s kind of like the way it used to be with Bayesians back in the ’60s and ’70s. The whole thing with Bayesians was, “Well, if you’re not a Bayesian, you’re not coherent.” And they would quote theorems by Savage and so on, about coherence, and things like that. It was all very nice math, and it didn’t convince very many people that they had to be Bayesians. But, when Bayesian methods became usable, with computing power, with MCMC and things like that, then all the sudden, people are a lot more interested in Bayesian methods. And, they’re still not interested in them because if you aren’t a Bayesian then you aren’t coherent. That’s not why the biologists are using Bayesian methods to develop genetic trees and stuff like that. It’s because they work and they give useful answers. So, just screaming about you need to know these theorems from the mid 20th century because that’s the right way to look at statistics, the right way to think about things, even though I may think that’s true, that’s not going to convince very many people that that’s what they need to be doing.
NPS: That’s not an argument, yeah. What I had been able to do, I don’t necessarily share all the methodology, but I show my coworkers estimators for certain quantities we care about, and they have no idea where the estimator comes from. That’s kind of a … and that it’s, under Lehmann–Scheffé, it is optimal so long as it’s unbiased and based on the sufficient statistics. But, they don’t know any of those concepts. And the fact that you can use Rao-Blackwell to get estimators that can reduce our sample complexity, sometimes by 40%, and we’re talking about page views on Bing ads, or on Bing, so that this could be really, really huge. So, that’s what I’ve tried to do to evangelize it. I think, I hope that’s sort of in keeping with the spirit of what you mentioned, to show some interesting results to get them curious about that.
RLB: Yes.
Onward and Upward in Retirement
NPS: Well, I guess that leads me to the last question, which is retirement plans. Now that you are retired, what is the future for Professor Roger Berger?
RLB: I’ll still be doing some statistics. Still got a few papers in my head that have been there for a few years that need to be written, and I plan to get to them. But, I am enjoying doing a lot of other things also. My wife and I enjoy traveling. In the last three months, we’ve been to Guatemala, we’ve been to the Netherlands, we’ve been to Canada. So, that’s just from May to August. We have more plans like that in the future. It’ll be a combination of true retirement, enjoying other things, as well as keeping my hand in statistics and so on. One of the best things about retirement is when people send me papers to referee. I tell them that I only referee papers now that really grab me, the abstract grabs me as being something incredibly interesting. I feel no obligation to referee a certain number of papers a year or anything like that. So, that’s very liberating. That’s a great part of retirement, is being able to say no without any guilt.
NPS: Wow. Well, very much appreciate you taking the time to do this. I know that there will be a lot of people interested in hearing all of the things that you have to say, and perhaps we can do this again sometime in the future.
RLB: Thank you Neil, for inviting me to do this. It’s been enjoyable. I hope we didn’t tax the listeners by the length of it. We went on a little longer than we had planned, but it’s been great fun.
NPS: Well, in the world of long commutes on the highway, an hour and a half isn’t actually that long. Thank you very much.
